The 1 TB Test: Is Your Memory and Storage Sales Growth Real, or Just Price?
Memory and storage sales numbers have never looked better. Revenue charts point straight up, margins are at record levels, and many sales teams are beating their targets by wide margins.
But one simple question is rarely asked: how much of that growth comes from selling more, and how much comes from prices going up?
Since early 2025, a shortage driven by demand for AI hardware has pushed the price of memory and storage up two to five times. When the price of what you sell multiplies, revenue multiplies with it, even if you sell exactly the same amount. This article uses one simple test to separate the two.
In short:
- Selling the same 1 TB each of RAM, SSD and HDD now bills 4.78 times what it did in early 2025.
- That increase comes entirely from price, not from selling more.
- To see real growth, compare each product’s sales growth with its own price increase.
- If prices fall, targets based on today’s dollar revenue could become very hard to reach, even with steady sales volume.
The 1 TB test
Imagine a seller who sells exactly 1 TB of RAM, 1 TB of SSD and 1 TB of HDD every quarter. Same products, same quantity, same effort, every single quarter.
Here is what that identical work billed at retail prices:
| 1 TB sold | Billed in Q1 2025 | Billed in Q3 2026 | Bill multiplied by |
|---|---|---|---|
| RAM (DDR5) | $2,970 | $14,404 | 4.85× |
| SSD (NVMe) | $75 | $177 | 2.36× |
| HDD | $16.50 | $40.40 | 2.45× |
| All three | $3,062 | $14,622 | 4.78× |
The same 3 TB brought in 4.78 times more money. On a sales dashboard, that shows up as +378% growth. Measured in terabytes, nothing changed.
This is a measurement method, not a judgment of any person, team or company. Prices are set by the market, and higher dollar sales are still real cash. The method simply separates the effect of market prices from changes in volume.
This leads to one simple rule: more terabytes were sold only if billing grew faster than that product’s multiplier.
What 1 TB bills, quarter by quarter
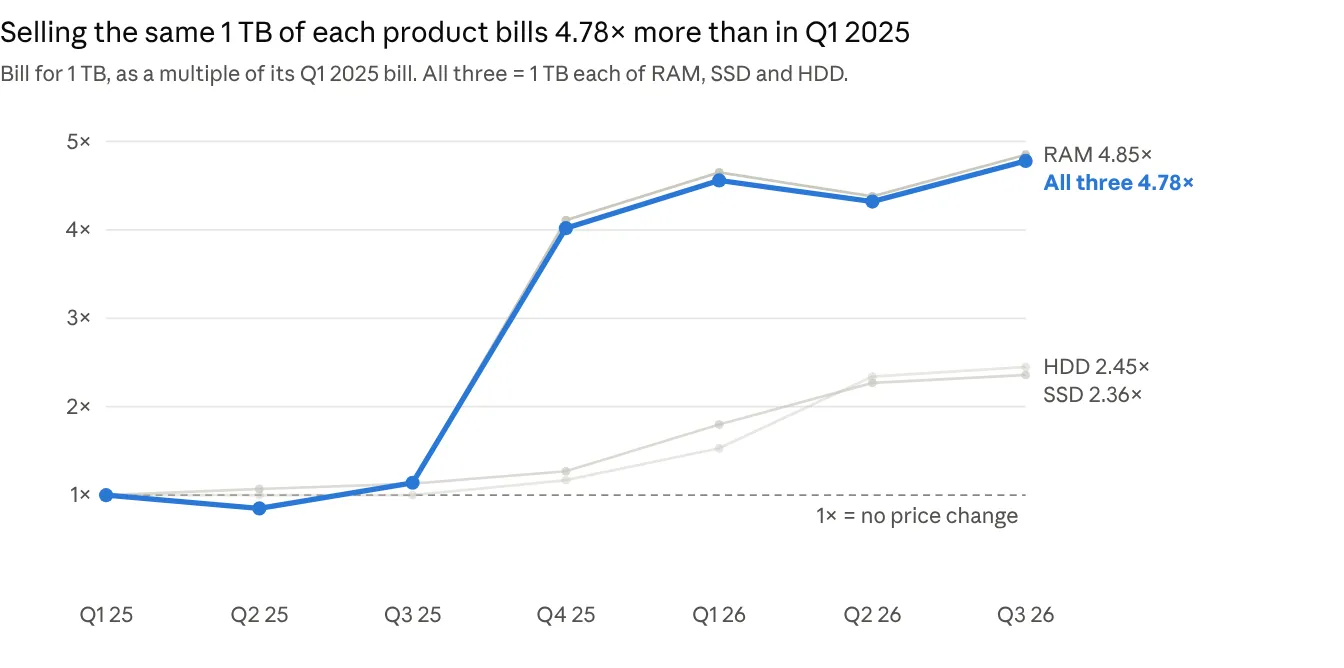
Retail price per TB as a multiple of Q1 2025. RAM: 32GB DDR5 kits; SSD: mainstream NVMe; HDD: 30TB enterprise drives. Sources are listed at the end.
RAM dominates the total because 1 TB of RAM costs 180 to 360 times as much as 1 TB of HDD. That is why each product should be measured against its own price line, not against the combined total.
| Quarter | 1 TB RAM | 1 TB SSD | 1 TB HDD | All three |
|---|---|---|---|---|
| Q1 2025 | $2,970 | $75 | $16.50 | $3,062 |
| Q2 2025 | $2,495 | $80 | $16.50 | $2,592 |
| Q3 2025 | $3,386 | $85 | $16.50 | $3,487 |
| Q4 2025 | $12,207 | $95 | $19.30 | $12,322 |
| Q1 2026 | $13,810 | $135 | $25.20 | $13,970 |
| Q2 2026 | $13,009 | $170 | $38.60 | $13,218 |
| Q3 2026 | $14,404 | $177 | $40.40 | $14,622 |
Industry reporting shows the same pattern. In one 2026 quarter, Micron reported DRAM prices up about 60% while the number of bits it shipped grew only in the low single digits (SiliconANGLE). Analysts describe the memory market’s 2026 growth as driven by price rather than volume (SoftwareSeni).
Same work, bigger bill
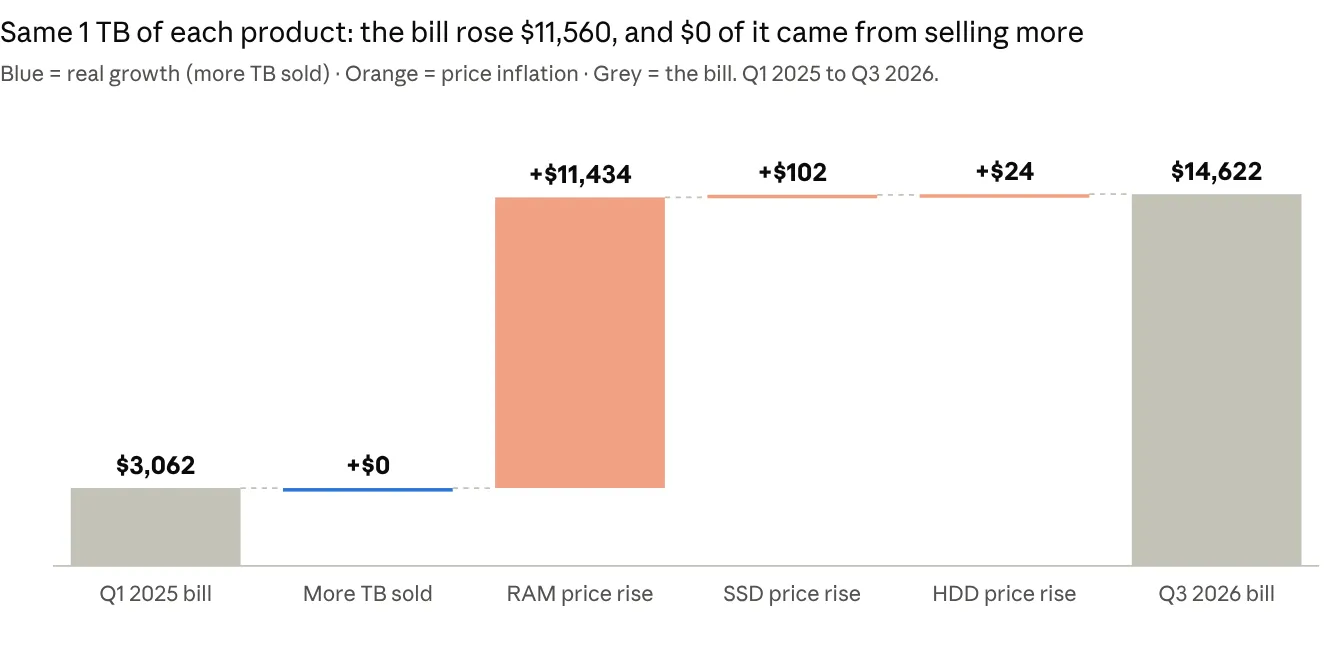
Between Q1 2025 and Q3 2026, the bill for the same 3 TB grew by $11,560. Higher RAM prices account for 99% of that increase. Volume contributed nothing, because volume did not change.
Margin: gains from price movements
Price movements can raise reported margin in two ways, and neither depends on sales volume.
- Bigger invoices, same margin %. If the margin rate stays the same, margin dollars on 1 TB grow 4.78×, exactly in line with the bill.
- Stock held while prices move. When stock is bought in one quarter and sold in the next, any price rise in between adds to margin. This is a timing effect of the market, separate from sales volume.
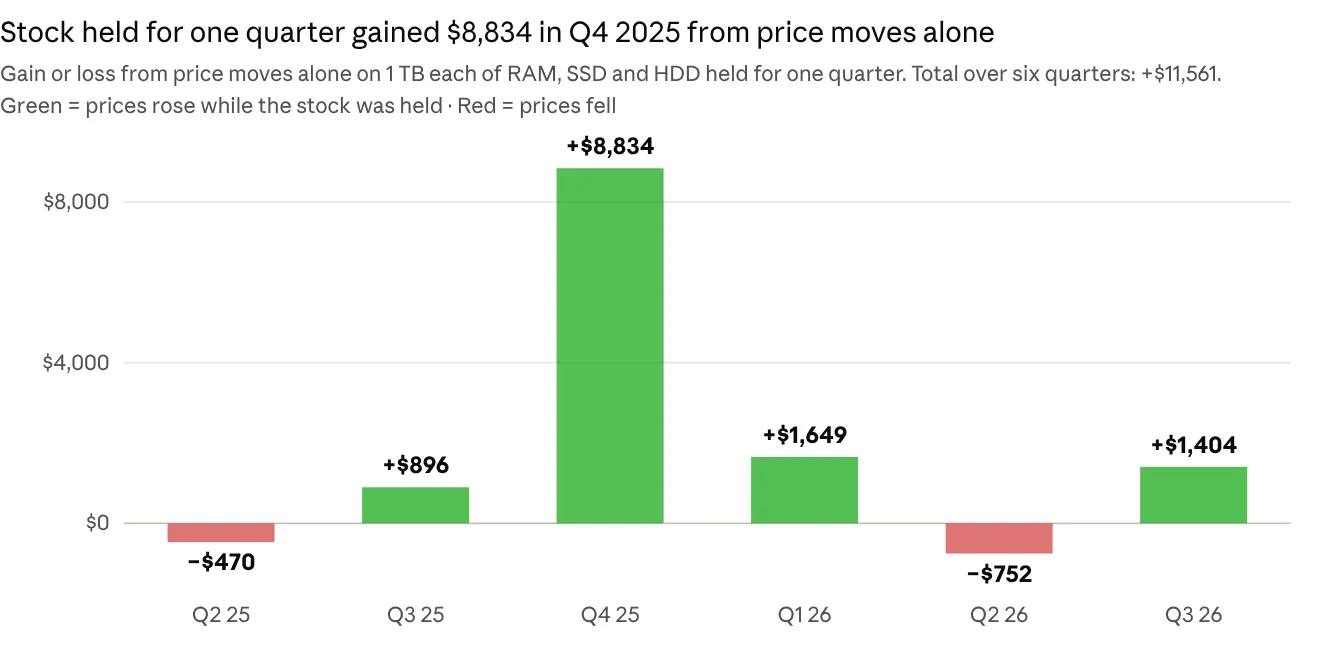
Gain = this quarter’s retail price minus last quarter’s, for 1 TB each of RAM, SSD and HDD.
In Q4 2025, holding 1 TB of each product for one quarter gained $8,834 from price moves alone, nearly three times its entire Q1 2025 bill. The effect also works in reverse: it became a loss in Q2 2025 and Q2 2026, when prices dipped.
Reading growth by product: the divide-by rule
To see real growth, take a product’s billing growth (how many times higher billing is than in Q1 2025) and divide it by that product’s price multiplier from the table below. A result above 1.0 means more terabytes were sold; below 1.0 means fewer.
| Quarter | RAM | SSD | HDD | All three |
|---|---|---|---|---|
| Q1 2025 | 1.00 | 1.00 | 1.00 | 1.00 |
| Q2 2025 | 0.84 | 1.07 | 1.00 | 0.85 |
| Q3 2025 | 1.14 | 1.13 | 1.00 | 1.14 |
| Q4 2025 | 4.11 | 1.27 | 1.17 | 4.02 |
| Q1 2026 | 4.65 | 1.80 | 1.53 | 4.56 |
| Q2 2026 | 4.38 | 2.27 | 2.34 | 4.32 |
| Q3 2026 | 4.85 | 2.36 | 2.45 | 4.78 |
Price multiplier per product, compared with Q1 2025.
Three quick examples for Q3 2026:
- RAM billing up 4×: 4 ÷ 4.85 = 0.82, or 18% fewer terabytes, even though dollar sales show +300%.
- SSD billing up 3×: 3 ÷ 2.36 = 1.27, or 27% more terabytes.
- HDD billing up 2.5×: 2.5 ÷ 2.45 = 1.02, or 2% more terabytes.
Ranked by dollar growth, RAM comes first. Ranked by terabyte growth, SSD does. Both views are valid; they answer different questions. Dollar growth shows the cash coming in. Terabyte growth shows how much more was actually sold.
Is this a bubble?
Not in the strict sense. A bubble is a price pushed up by speculation with nothing real behind it. Today’s memory prices reflect a genuine shortage of chips. But the effect this article measures has well-established names:
| Term | What it means here |
|---|---|
| Money illusion | Reading dollar growth as real growth. The term was coined by economist Irving Fisher (EPFL Graph Search). |
| Phantom profits (inventory profits) | Margin from stock bought at an older, lower cost and sold at today’s higher price. It is usually temporary (AccountingTools). |
| Supercycle, or “hog cycle” | High prices lead every producer to add capacity; new factories come online at the same time, and the resulting oversupply pushes prices down sharply (TechFlow). |
We have seen this before
The same pattern has played out many times, in technology and beyond. In each case, revenue and profit rose sharply on price and then reversed, while volume remained the steadier measure.
| Period | Market | What happened |
|---|---|---|
| 1973–1974 | US companies overall | Phantom profits were estimated at about 40% of reported US corporate profits in Q2 1973 (Hazlitt, Mises Institute) |
| 2011–2014 | Hard drives | Thailand floods pushed prices up 72.7%, from $0.055 to $0.095 per GB, before they eased back to pre-flood levels (Tom’s Hardware) |
| 2017–2019 | DRAM memory | Nine straight quarters of price rises ended in late 2018 (The Register); in 2019 prices fell nearly 30% in a single quarter (KitGuru) |
| 2021–2022 | Lumber (US) | Prices rose more than 300% from pre-pandemic levels, then fell about 75% from the peak (Fortune, The Daily Economy) |
| 2021–2024 | Container shipping | Asia–US West Coast rates rose about 10× in 2021, then by 2024 fell to levels Maersk’s CEO described as unsustainable (Supply Chain Digest, ThisDay) |
| 2022 | Consumer goods | Prices rose more than 10% while volume fell, yet net sales stayed high (McKinsey) |
The target trap
This is where the distinction matters most. Next year’s sales targets are usually set from this year’s dollar revenue. That quietly assumes today’s prices will continue.
If prices fall, the same terabytes bring in fewer dollars, and a dollar target becomes much harder to reach even when volume holds steady:
| If RAM prices in 2027… | 1 TB of RAM bills | Change vs Q3 2026 | TB needed to match Q3 2026 dollars |
|---|---|---|---|
| stay at the Q3 2026 level (4.85×) | $14,404 | 0% | 1.0 TB |
| fall 25% (3.64×) | $10,803 | −25% | 1.3 TB |
| fall halfway back (2.40×) | $7,128 | −51% | 2.0 TB |
| return to Q1 2025 (1.00×) | $2,970 | −79% | 4.9 TB |
Illustrative scenarios, not forecasts.
Rising prices inflate results; falling prices deflate them, whatever happens to volume. Some common ways to keep targets fair in both directions:
- Set targets in volume (TB or units) together with a margin %, not in dollars alone.
- Add a price clause: if market prices move beyond an agreed range, the dollar target adjusts with them.
- Report both views every quarter: dollar sales alongside terabytes sold.
- Value stock at the cost to restock it today, so that gains from price moves are not mistaken for sales performance.
How fast can prices fall?
Past price spikes have often unwound faster than they built up, though not always.
- Fast: US lumber futures fell more than 40% in June 2021 alone, their worst month on record since 1978 (CNBC via AMAST). DRAM fell nearly 30% in one quarter in 2019.
- Gradual: hard drives took a few years to return to pre-flood prices after the 2011 floods.
Prices tend to fall quickly because the forces that pushed them up reverse together: buyers who stockpiled pause their orders, sellers holding stock cut prices to clear it, and new factories start producing at the same time.
Two things to watch in the current cycle:
- Early signs in flash memory. NAND chip spot prices fell 9.19% in a single week in late October 2026 (TrendForce), and some distributors in China sold off stockpiled memory modules (TechFlow). DRAM spot prices, however, were still near record highs.
- Long-term contracts may soften the fall. Many large buyers now have multi-year agreements with agreed price ranges, which TrendForce expects to smooth the cycle (TrendForce). Spot and retail prices may still move faster than contract prices.
When prices fall, phantom profits work in reverse. Stock bought at higher prices has to be sold at lower ones, so margins can shrink even when volume is healthy.
The takeaway
Dollar growth and volume growth are both real, but they tell different stories. In a market where prices have multiplied, judging performance on dollars alone gives people credit for market moves on the way up, and holds them responsible for market moves on the way down.
Measuring in terabytes, valuing stock at the cost to restock, and building price clauses into targets protect both companies and their teams, whichever way prices move next.
Key terms
- TB (terabyte): a unit of storage capacity, equal to 1,000 gigabytes (GB).
- RAM / DRAM: a computer’s working memory. DDR5 is the current generation.
- SSD / NAND: solid-state drives, built on NAND flash memory chips.
- HDD: a traditional hard disk drive with spinning platters.
- Spot price: the price for immediate purchase, as opposed to a price fixed in a longer-term contract.
Notes on the data
Prices are retail prices per TB from public trackers. Trackers can differ by up to about 30%, the HDD series uses 30TB enterprise drive prices, and Q1 2025 RAM and SSD levels are estimated from the trend. A company’s own purchase prices would give a more exact multiplier.
Sources
Price data: Capital and Compute – RAM price history · Newegg Insider – DDR5 in 2026 · Tech Insider – DDR5 price timeline · TechFuel HQ – DDR5 prices, Sep 2026 · StorageDiskPrices – SSD price history · PCSP – enterprise SSD and HDD by quarter
Further reading: TrendForce – 1Q26 DRAM industry up 81% QoQ · FTI Consulting – Price volume mix analysis · Gartner via Sales & Marketing Management – How inflation can undermine sales quotas · The Business Ferret – Real revenue growth